The commoditization of business intelligence tools, the rise of 'embedded intelligence'
Originally posted on the 645 Ventures blog (opens in a new tab)
Hans Peter Luhn was born in Germany in 1896. After a stint in the German army during World War I and a career in the textile industry, he moved to the United States and joined IBM in 1941, where he became manager of the information retrieval research division. After World War II, there was an increased need for organizations to catalog the new knowledge that was being created across different fields, and Luhn was one of the people leading IBM’s effort in that area. In 1958, he published a paper titled “A Business Intelligence System (opens in a new tab)”. The abstract is the following:
An automatic system is being developed to disseminate information to the various sections of any industrial, scientific or government organization. This intelligence system will utilize data-processing machines for auto-abstracting and auto-encoding of documents and for creating interest profiles for each of the “action points” in an organization.
More than 60 years after publication, the abstract describes the same problem organizations face today: making sense of all the data they create and allowing users to retrieve it and generate insights from that data. At the time, building such a system was quite difficult, as information was fragmented across many documents and computers. Neither databases nor the Internet even existed!
It wasn’t until 1966 that IBM created the Information Management System (IMS), the first database system, in order to support the Apollo space program. A few years later in 1970, Edgar Codd, another IBM employee, wrote a paper introducing the world to relational databases, but IBM didn’t commercialize the technology for several years, possibly due to a classic “Innovator’s Dilemma” (opens in a new tab) conundrum. This allowed Oracle (1977) to become the dominant database technology provider and build one of the largest tech companies of the past fifty years, speeding the adoption of databases across enterprises. Information began moving from unstructured documents to highly structured database systems, making it easier and easier to retrieve data.
Even with those advancements in database technology, business intelligence as we know it today didn’t really take off until data warehouses became more popular. Data warehouses allow organizations to move data from a wide array of databases to a single source of truth that can be used to run analyses. (1)
The late 1980s were the beginning of the business intelligence market as we know it today, pioneered by Cognos (opens in a new tab), a Canadian company which focused on business intelligence software for local networks. After going public in 1986, the company grew its revenues to 1 billion by 2007, at which point it was acquired by IBM for $5 billion (opens in a new tab). Due to their local network approach, Cognos’ products weren’t well-suited to be a category leader in an Internet-first world, and eventually fell behind the first generation of Internet-first business intelligence tools.
Internet-First Business Intelligence
Between the end of the 1990s and the mid 2000s, new companies providing business intelligence software were founded, including success stories like Alteryx (Founded in 1997, 3B acquisition by Thoma Bravo), OutlookSoft (15.7B acquisition by Salesforce). Their products were usually served through a desktop application tied to an internal server. Due to their complex nature, these software products required organizations to have full time staff to manage their installations, for example database administrators (an at-risk species nowadays!). Despite the resource requirements, these software platforms were a big improvement over previous solutions, as they allowed analysts to leverage data that might have been stored across different offices. Users could instead use a mix of application-specific interfaces and SQL to run their analyses. This greatly lowered the barrier of entry to use these tools, by allowing non-technical users to run their own analyses. You can see a screenshot of Tableau 1.0 below to get an idea of what that early experience was like.

Just like Cognos before them, Tableau and other companies of that era have been impacted by a new technological wave: cloud computing. This has created fundamental change in how data is created and consumed, moving away from on-premise databases to an online, distributed architecture.
Cloud-First Business Intelligence
As companies began migrating data to cloud warehouses like Amazon Redshift, Google BigQuery, and Hadoop (and eventually Snowflake) in the 2010s, a new generation of business intelligence software was born. These products include Looker ($2.6B acquisition by Google), SiSense (private unicorn), and Microsoft’s PowerBI . The barrier to entry was further lowered by the fact that anyone in the organization could now open their favorite tool in their browser and start running queries. Looker even created a new modeling language called LookML, removing SQL as a requirement to run complex queries and allowing Citizen Analysts (opens in a new tab) to quickly create reports.
The second big improvement with this wave of tools was data visualization and collaboration. Previously, if an analyst wanted to share a Tableau report, they had to go through a cumbersome process: they had to find the Tableau server IP address, publish it there, then share the link with their colleagues. Alternatively, they might export some of the learnings to a Powerpoint presentation and circulate it with their team. This process was greatly streamlined with cloud-first BI tools, as most of them lived in-browser. You could now easily share a link that your colleagues could open in a browser. The quality of the UI was also much better, allowing users to create nice looking dashboards to track company-wide goals. This in turn allowed the products to spread across different teams and levels of the organizations.
In addition to a new generation of private companies, there was the rise of open-source BI tools like Apache Superset (now commercialized by Preset.io), Metabase, and Redash, all of which became wildly popular. For engineering-heavy organizations, these are very attractive solutions as they avoid vendor lock-in and allow organizations to customize platforms to their specific use cases. They are also usually cheaper to adopt, as you can self-host them very easily on any cloud provider and try them out for a while without having to sign a contract.
This brings us to the present day. At this point in the business intelligence market life cycle, we don’t believe there is an opportunity for new billion dollar companies to be created just by offering data analysis and visualization tools. This is a space that has been commoditized by the vast amount of options available to the customer. The biggest opportunity we now see in the market is business intelligence platforms that allow companies to power both internal analysis and embedded intelligence.
The rise of “embedded intelligence” and our investment in Cube.js
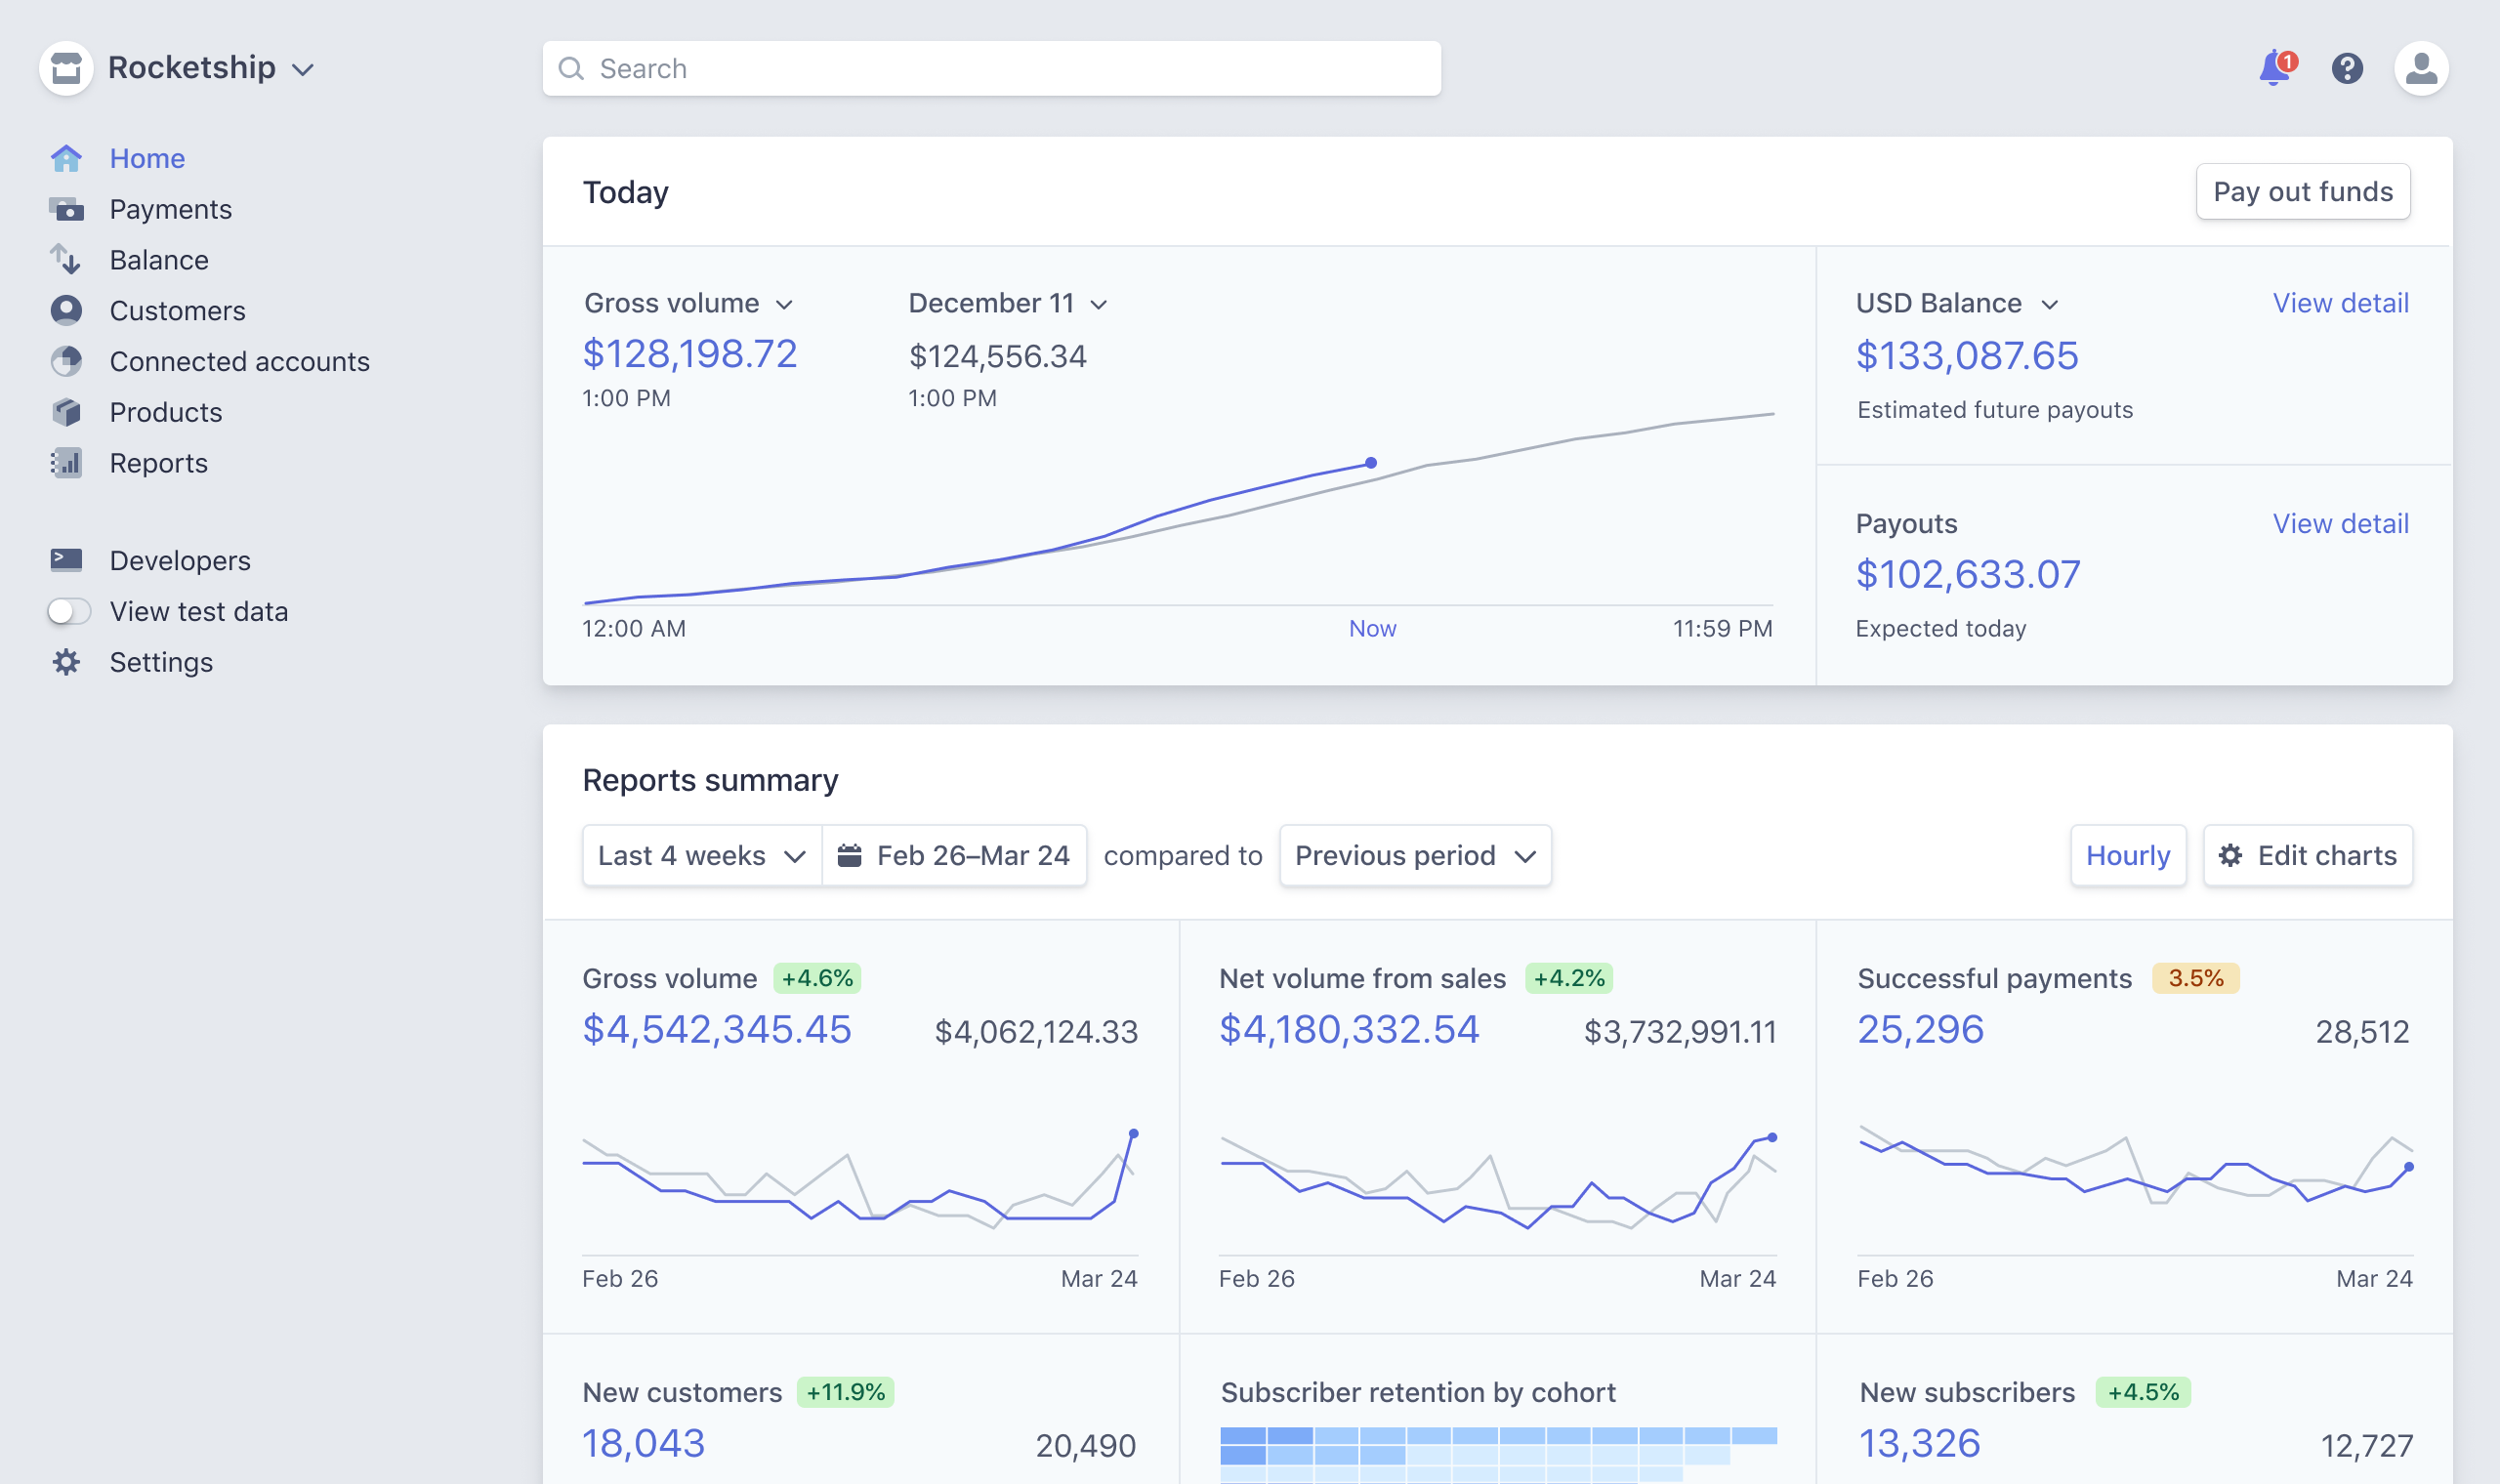
One important trend we have observed is the rise of embedded intelligence within software products. Take Stripe for example; their core offering is a payment API, which is what the developer is exposed to. On the other hand, Stripe’s web application is basically a business intelligence dashboard. Having a unified way of all of your revenue streams, data around your customers retention, growth of users, etc is crucial to running a business.
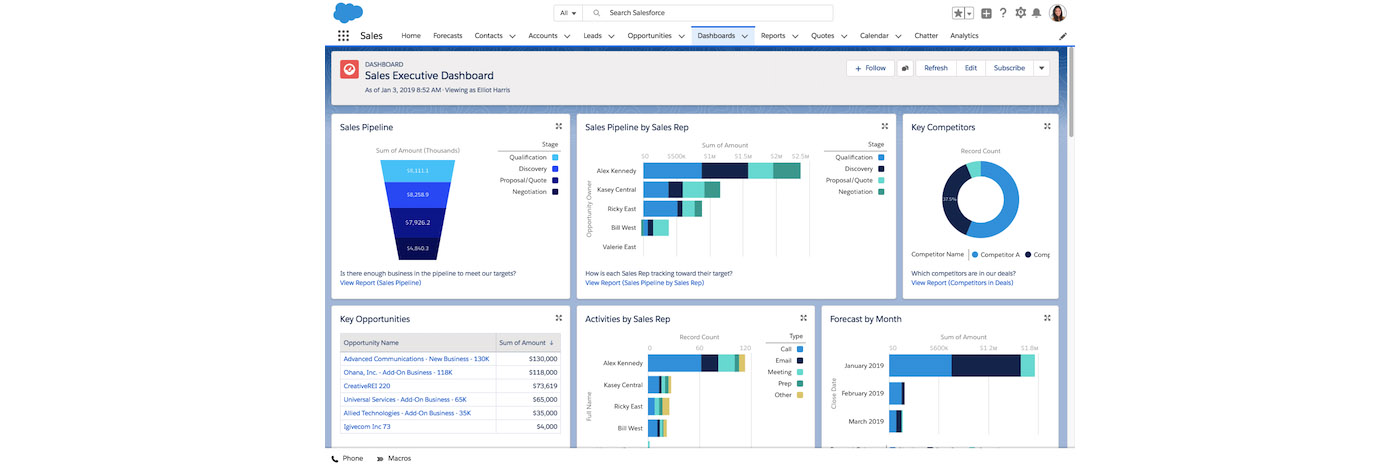
Salesforce is another good example; a CRM tool is great for managing your customers, but what’s even more important is the data underlying the CRM: for example, the average close rate of your sales team, your company’s average contract value, or your pipeline for the quarter. Salesforce allows you to see this with their “Dashboard” and “Reports” feature.
If you think about all the products that you use on a daily basis as a knowledge worker, you will notice that charts and graphs are a core part of a lot of them. This is due to the fact that the insights gathered from the data your usage generates are just as important as the product itself. Offering analytics and reporting with software products is becoming table stakes.
When companies build these embedded intelligence experiences, or internal analytics dashboards, engineers might use an open source library like Chart.js or D3 for the visualization, axios to fetch it from the backend, and build software to query the data from storage. They usually leverage the ORM framework provided by their backend (ActiveRecord for Ruby on Rails, Django ORM for Python, Sequelize for Node.js, etc) to access the data, rather than writing pure SQL queries. For basic use cases, this isn’t very hard to do, and a single engineer can create basic reporting pretty easily. As the application grows, however, implementations start to hit multiple limitations:
- Querying performance: as the amount of data being analyzed grows, it becomes harder to deliver results in a timely manner. This usually leads to a degradation of the user experience, which can negatively impact your business. A frontend/full stack engineer might not be proficient enough in SQL to rewrite their ORM queries in a more efficient manner.
- Caching complexity: some of these queries begin to get pretty expensive and the data isn’t very dynamic, so you resort to caching. As the application grows, managing cache expiration becomes challenging.
- Multi-data store analysis: when running queries, you might need to join data from multiple databases or data warehouses. This isn’t trivial to do in a performant way, and it might not be supported at all by the ORM you are using. This limitation also applies to traditional BI tools. For example, Tableau didn’t have support for hosted MySQL and PostgreSQL databases until 2015 (opens in a new tab).
An alternative to having these experiences built by your engineers is using tools like Mode.com and ObservableHQ, which allow data scientists and analysts to build reports, dashboards, and data-driven experiences. These can then be embedded into websites and tools. While they provide a quick way to embed intelligence, they only work for analysis on data you own, rather than serving as a framework on which you can build customer-facing experiences.
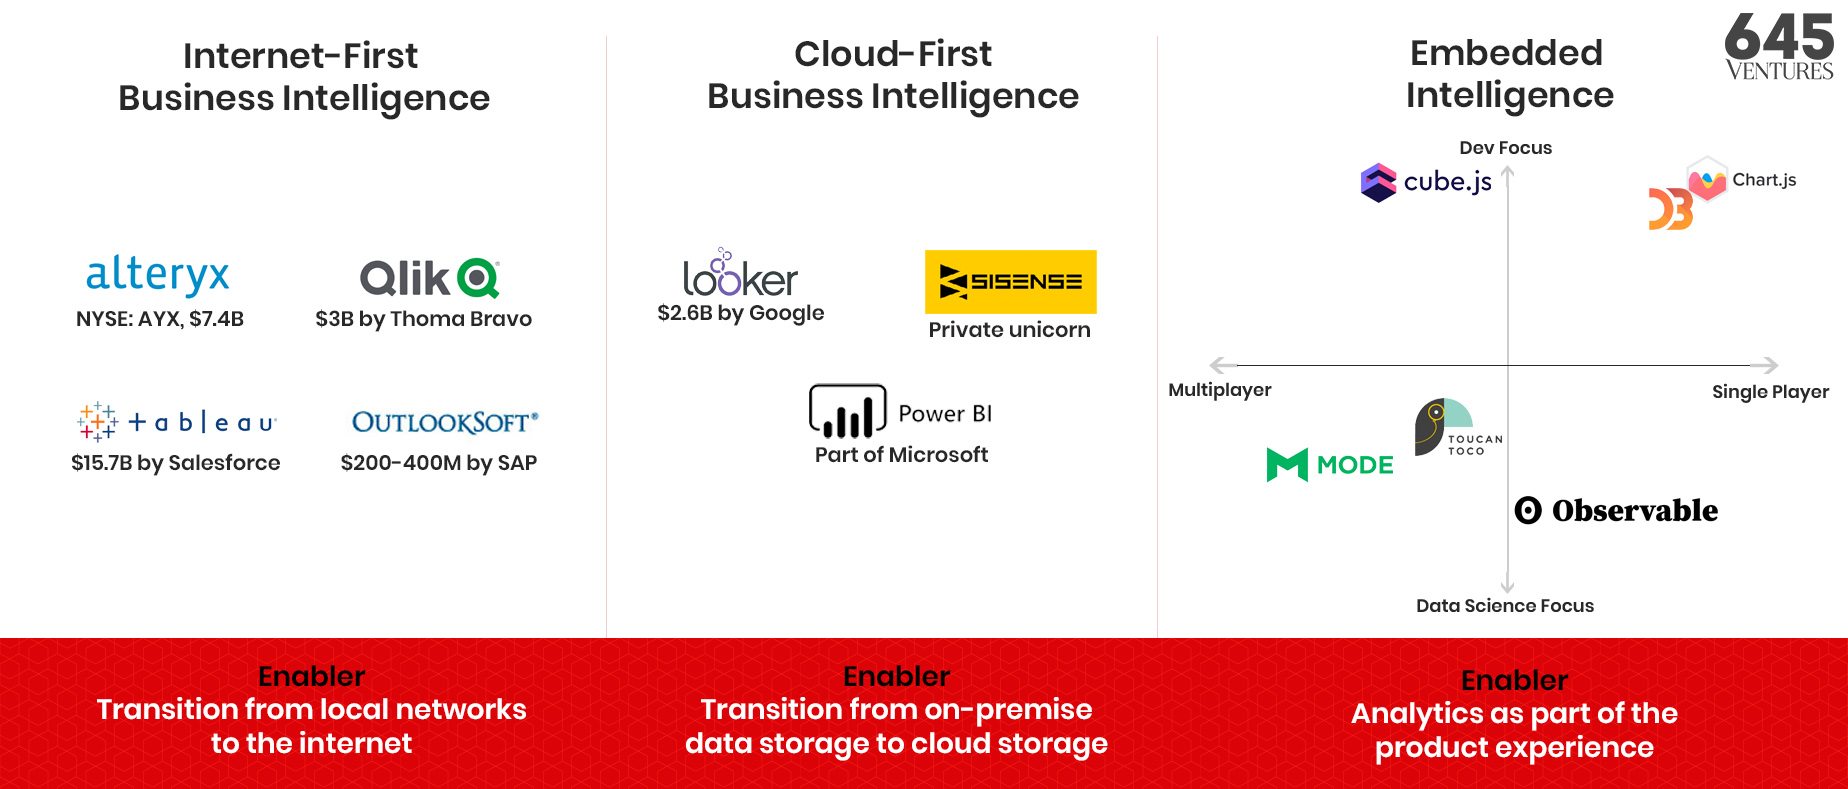
When thinking about embedded intelligence, there’s two axes that we categorize these tools on: on one axis, there’s products focused on the developer experience, contrasted by data science-focused ones. On the other axis, the spectrum goes from single player to multiplayer. The way we think about it is the following: how quickly does this product’s usefulness increase compared to the scale of deployment? For products like Chart.js, no matter how many users within your organization use it, it has the same amount of usefulness. On the other hand, a platform like Cube keeps increasing in value as it spreads across the organization, allowing more and more developers to leverage connections that are being created. Observable is just to the right of the axis because while their collaboration features are very useful, the core experience remains similar.
Our Investment In Cube
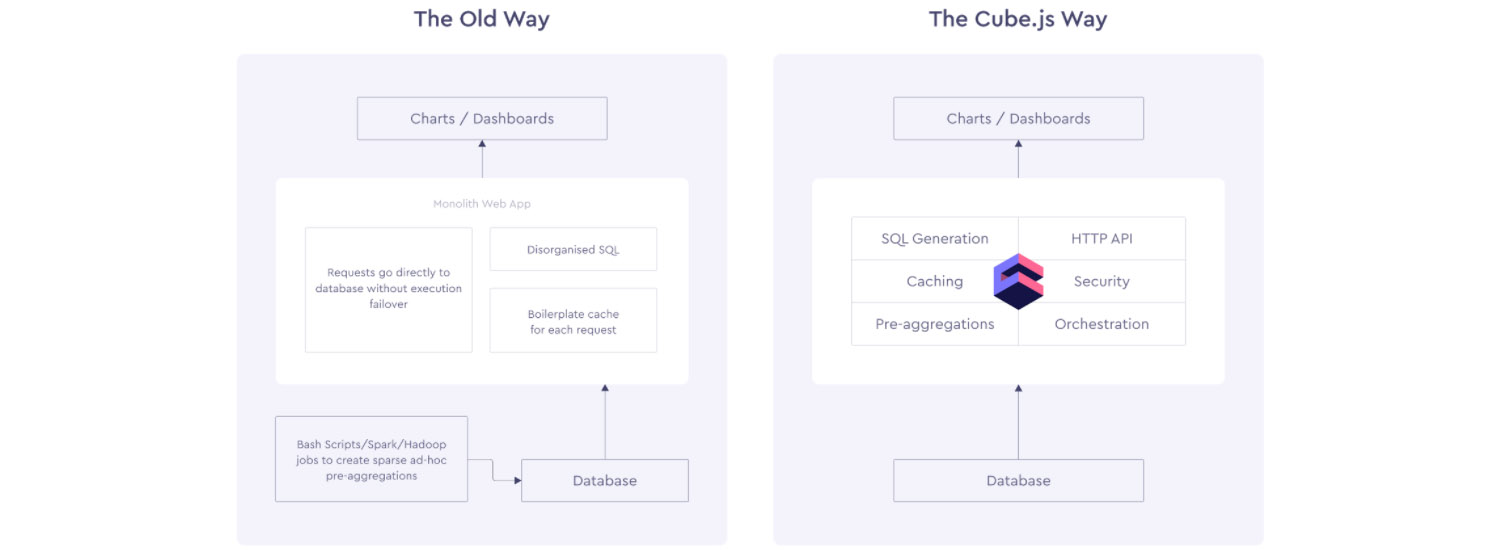
As part of our Engineering Value Chain Revolution (opens in a new tab) investment theme, we are always looking for founders who create better tooling for engineering teams to build products. Earlier this year, I found an open source project called Cube.js, an analytics platform that aimed to abstract away the issues that I mentioned earlier from developers. Their goal is to create a layer between your analytics and your data store that takes care of query pre-aggregation, caching, API boilerplates, etc, allowing developers to focus on the user experience rather than the data piping.
We believe a product like Cube can be widely adopted by developers working at startups as well as large enterprises. In Stripe’s “Developer Coefficient” (opens in a new tab) report, executives listed four major pain points that developers can address: “Bringing products to market faster” and “Internal reporting / visibility” were two of them. The adoption of Cube can help companies cut down on development time by abstracting complexity away, and then use that same infrastructure to also spin up internal reporting. We believe developer productivity will be a big focus in the next decade (and why we are so excited about also being investors in DeepSource (opens in a new tab)) and it will generate multiple billion dollar companies.
While the core product is developer focused, Cube also has a “Playground” where non-technical users can experiment with creating queries and building dashboards without the need for engineering support by leveraging Templates (opens in a new tab). We believe that in the long run, Cube has the potential to displace existing BI tools by using their developer experience as a wedge, a product offering incumbents can’t compete with. This further increases the opportunity for Cube to build an iconic company.
Cube.js was born within Statsbot, a business intelligence platform that had signed up customers like Giphy, HQ Trivia, and Housing Anywhere, and had 40,000 users on it. Artyom and Pavel, two of the founders, decided to spin out Cube.js as its own business and focus on building a developer-first experience instead. This is when cube.dev (opens in a new tab) got created. Their open source project quickly grew to almost 10,000 stars, attracting thousands of users in their community groups.
Earlier this year I had a chance to try out the product and contribute to the open source project. The developer experience was much better than any of the alternatives I had previously tried, and I reached out to the team to learn more about their future plans. We grabbed dinner a couple of times where Artyom and Pavel talked about what then became Cube Cloud (opens in a new tab), a fully-managed hosted offering that allows organizations to focus on building data-driven products, rather than spending time on how the data itself gets to the frontend.
We are very excited to announce our investment in Cube alongside a great syndicate including Bain Capital Ventures, Eniac, Innovation Endeavors, and more. We believe Artyom, Pavel, and the whole team have a chance to revolutionize the $23B business analytics market, and we couldn’t be more happy to partner with them on this journey.
(1) Unsurprisingly, this was also an idea born at IBM in the 1980s, led by Barry Devlin and Paul Murphy. In 2014, IBM finally released the cloud version of IBM Db2 Warehouse.
© Alessio Fanelli.RSS